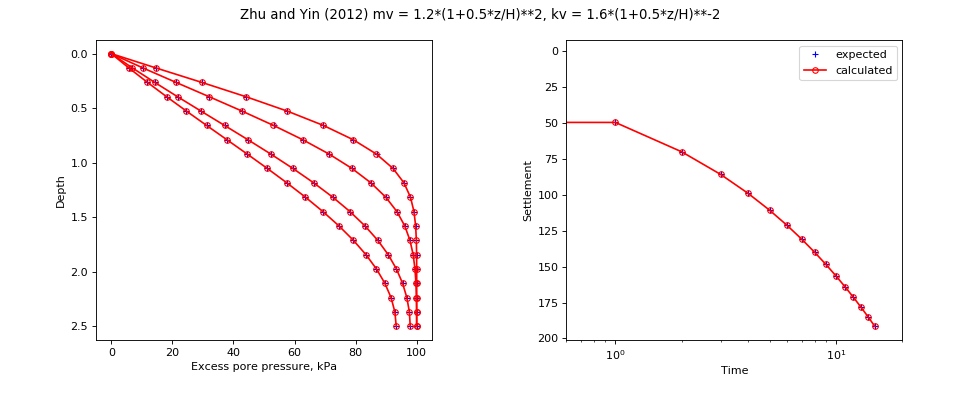
speccon example code: speccon1d_vr_vert_with_depth_dependent_mv_kv_zhuandyin2012.py
# speccon1d_vr example (if viewing this in docs, plots are at bottom of page)

# Vertical drainage with depth dependent permeability and compressibility.
# Zhu and Yin (2012) give an analytical solution for vertical consolidation
# where kv and mv vary according to mv = mv0*(1+alpha*z/H)**q and
# kv = kv0* (1+alpha*z/H)**p.  To model using speccon1d_vr we approximate the
# distributinos with piecewise linear function.  The orignal solution of
# Zhu and Yin (2012) is implemented separately in
# geotecha.consolidation.zhuandyin2012

# Zhu, G., and J. Yin. 2012. 'Analysis and Mathematical Solutions
# for Consolidation of a Soil Layer with Depth-Dependent Parameters
# under Confined Compression'. International Journal of Geomechanics
# 12 (4): 451-61.

# Note there are many more of these examples in the speccon_1d_vr test
# routines that can be found in the geotecha sourrce code

# This file should be run with python.  It will not work if run with the
# speccon1d_vr.exe script program.

from __future__ import division, print_function
import numpy as np
from geotecha.speccon.speccon1d_vr import Speccon1dVR
import matplotlib.pyplot as plt

#Expected values
#t = time values
#tpor = time values por pore ressure vs depth output
#z = depth values
#por = excess pore pressure at time tpor and depth z.
#settle = settlement
t = np.array([  0.,   1.,   2.,   3.,   4.,   5.,   6.,   7.,   8.,   9.,  10.,
    11.,  12.,  13.,  14.,  15.])

z = np.array([ 0.        ,  0.13157895,  0.26315789,  0.39473684,  0.52631579,
    0.65789474,  0.78947368,  0.92105263,  1.05263158,  1.18421053,
    1.31578947,  1.44736842,  1.57894737,  1.71052632,  1.84210526,
    1.97368421,  2.10526316,  2.23684211,  2.36842105,  2.5       ])

tpor = t[np.array([2,4,9,13])]

por = np.array(
 [[  0.        ,   0.        ,   0.        ,   0.        ],
   [ 14.67355514,  10.40528932,   6.9478055 ,   5.78180724],
   [ 29.57888041,  21.1645055 ,  14.20340783,  11.8343646 ],
   [ 44.09888584,  32.05180943,  21.70257559,  18.12252389],
   [ 57.58320674,  42.8013085 ,  29.36397652,  24.60042608],
   [ 69.44444839,  53.12388946,  37.08988223,  31.21115238],
   [ 79.25845477,  62.73135179,  44.76833267,  37.88694384],
   [ 86.83932182,  71.36544094,  52.27696814,  44.55012872],
   [ 92.26237958,  78.82739783,  59.48856982,  51.11485949],
   [ 95.82413544,  85.0022523 ,  66.27810786,  57.48969044],
   [ 97.95205743,  89.87205113,  72.53079584,  63.58092097],
   [ 99.09709856,  93.51401605,  78.15033325,  69.29648861],
   [ 99.64623111,  96.08312814,  83.06624662,  74.55003194],
   [ 99.87831495,  97.78286166,  87.23908646,  79.26457494],
   [ 99.96373069,  98.83118188,  90.66226567,  83.3751421 ],
   [ 99.99076102,  99.43000313,  93.35956014,  86.82953547],
   [ 99.99801788,  99.74450265,  95.37770132,  89.58653348],
   [ 99.99964732,  99.89475021,  96.77397903,  91.61094907],
   [ 99.99994823,  99.95773745,  97.59921715,  92.86534606],
   [ 99.99998809,  99.97464489,  97.8768125 ,  93.29878245]])

settle = np.array(
[ [   1.92503833,   49.44309786,   69.92309956,   85.63795758,
     98.88619572,  110.55812783,  121.11036104,  130.81414062,
    139.84619549,  148.32927168,  156.35271013,  163.98389265,
    171.27505923,  178.26759418,  184.99484499,  191.48405032]])

####################################
#zhuandyin2012 properties to generate expected output
#ui = 100
#drn = 1
#nterms = 50
#mv0 = 1.2
#kv0 = 1.6
#H = 2.5
#alpha = 0.5
#q = 2
#p = -2
#z = np.linspace(0,H,20)
#t = np.linspace(0,15,16)
#tpor=t[np.array([2,4,9,13])]
#plot_eigs=False
#
#por, doc, settle = zhuandyin2012(
#    z=z, t=t, alpha=alpha, p=p, q=q, drn=drn, tpor=tpor, H = H, kv0 = kv0, mv0 = mv0, gamw = 10,
#        ui = 100, nterms = nterms, plot_eigs=plot_eigs)

####################################

reader = ("""\
neig=40

H = 2.5
drn = 1

mvref = 1.2
kvref = 1.6 / 10

kv = PolyLine(np.array(
    [ 0. ,  0.1,  0.2,  0.3,  0.4,  0.5,  0.6,  0.7,  0.8,  0.9,  1. ]),
              np.array(
    [ 1.        ,  0.90702948,  0.82644628,  0.75614367,  0.69444444,
    0.64      ,  0.59171598,  0.54869684,  0.51020408,  0.47562426,
    0.44444444]))
mv = PolyLine(np.array(
    [ 0. ,  0.1,  0.2,  0.3,  0.4,  0.5,  0.6,  0.7,  0.8,  0.9,  1. ]),
              np.array(
    [ 1.    ,  1.1025,  1.21  ,  1.3225,  1.44  ,  1.5625,  1.69  ,
    1.8225,  1.96  ,  2.1025,  2.25  ]))


dTv = kvref/mvref/H**2

surcharge_vs_time = PolyLine([0,0,10], [0,100,100])
surcharge_vs_depth = PolyLine([0,1], [1,1])


ppress_z = np.array(
    [ 0.        ,  0.13157895,  0.26315789,  0.39473684,  0.52631579,
    0.65789474,  0.78947368,  0.92105263,  1.05263158,  1.18421053,
    1.31578947,  1.44736842,  1.57894737,  1.71052632,  1.84210526,
    1.97368421,  2.10526316,  2.23684211,  2.36842105,  2.5       ])

ppress_z/=H

settlement_z_pairs = [[0,1]]

tvals = np.array(
  [  0.,   1.,   2.,   3.,   4.,   5.,   6.,   7.,   8.,   9.,  10.,
    11.,  12.,  13.,  14.,  15.])

ppress_z_tval_indexes = [2,4,9,13]
""")


a = Speccon1dVR(reader)
a.make_all()

# custom plots
title = ("Zhu and Yin (2012) mv = 1.2*(1+0.5*z/H)**2, kv = 1.6*(1+0.5*z/H)**-2")
fig = plt.figure(figsize=(12,5))
fig.suptitle(title)
#z vs u
ax1 = fig.add_subplot("121")
ax1.set_xlabel('Excess pore pressure, kPa')
ax1.set_ylabel('Depth')
ax1.invert_yaxis()
ax1.plot(por, z,
         ls="None", color='Blue', marker="+", ms=5,
         label='expected')
ax1.plot(a.por, z,
         ls='-', color='red', marker='o', ms=5, markerfacecolor='None',
         markeredgecolor='red',
         label='calculated')


# settlement vs t
ax3 = fig.add_subplot("122")
ax3.set_xlabel('Time')
ax3.set_ylabel('Settlement')
ax3.invert_yaxis()
ax3.set_xscale('log')
ax3.set_xlim((0.6, 20))
ax3.plot(t, settle[0],
         ls="None", color='Blue', marker="+", ms=5,
         label='expected')
ax3.plot(t, a.set[0],
         ls='-', color='red', marker='o', ms=5, markerfacecolor='None',
         markeredgecolor='red',
         label='calculated')
leg = ax3.legend()
leg.draggable()

fig.subplots_adjust(top=0.90, bottom=0.15, left=0.1, right=0.94, wspace=0.4)
#fig.tight_layout()
plt.show()
(Source code, png, hires.png, pdf)

