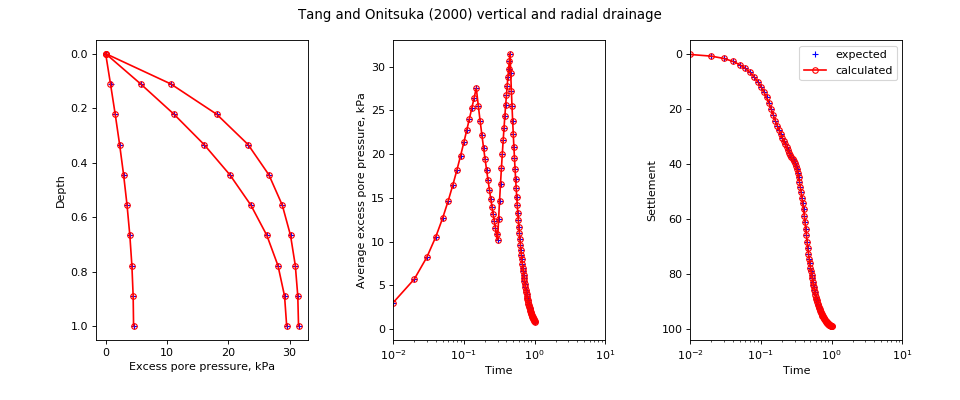
speccon example code: speccon1d_vr_vert_and_radial_drainage_tangandonitsuka2000.py
# speccon1d_vr example (if viewing this in docs, plots are at bottom of page)

# Reproduce solution of Tang and Onitsuka (2000) which includes vertical and
# radial drainage in a unit cell.  The orignal solution of Tang and Onitsuka
# (2000) is implemented separately in
# geotecha.consolidation.tangandonituka2000.

# Tang, Xiao-Wu, and Katsutada Onitsuka. (2000) 'Consolidation by
# vertical drains under Time-Dependent Loading'. Int
# Journal for Numerical and Analytical Methods in
# Geomechanics 24, no. 9 (2000): 739-51.
# doi:10.1002/1096-9853(20000810)24:9<739::AID-NAG94>3.0.CO;2-B.


# This file should be run with python.  It will not work if run with the
# speccon1d_vr.exe script program.

from __future__ import division, print_function
import numpy as np
from geotecha.speccon.speccon1d_vr import Speccon1dVR
import matplotlib.pyplot as plt

#Expected values
#t = time values
#avp = average excess pore pressure
#z = depth values
#por = excess pore pressure at time t and depth z.
#settle = settlement
t = np.array([  1.00000000e-03,   2.00000000e-03,   3.00000000e-03,
     4.00000000e-03,   5.00000000e-03,   6.00000000e-03,
     7.00000000e-03,   8.00000000e-03,   9.00000000e-03,
     1.00000000e-02,   2.00000000e-02,   3.00000000e-02,
     4.00000000e-02,   5.00000000e-02,   6.00000000e-02,
     7.00000000e-02,   8.00000000e-02,   9.00000000e-02,
     1.00000000e-01,   1.10000000e-01,   1.20000000e-01,
     1.30000000e-01,   1.40000000e-01,   1.50000000e-01,
     1.60000000e-01,   1.70000000e-01,   1.80000000e-01,
     1.90000000e-01,   2.00000000e-01,   2.10000000e-01,
     2.20000000e-01,   2.30000000e-01,   2.40000000e-01,
     2.50000000e-01,   2.60000000e-01,   2.70000000e-01,
     2.80000000e-01,   2.90000000e-01,   3.00000000e-01,
     3.10000000e-01,   3.20000000e-01,   3.30000000e-01,
     3.40000000e-01,   3.50000000e-01,   3.60000000e-01,
     3.70000000e-01,   3.80000000e-01,   3.90000000e-01,
     4.00000000e-01,   4.10000000e-01,   4.20000000e-01,
     4.30000000e-01,   4.40000000e-01,   4.50000000e-01,
     4.60000000e-01,   4.70000000e-01,   4.80000000e-01,
     4.90000000e-01,   5.00000000e-01,   5.10000000e-01,
     5.20000000e-01,   5.30000000e-01,   5.40000000e-01,
     5.50000000e-01,   5.60000000e-01,   5.70000000e-01,
     5.80000000e-01,   5.90000000e-01,   6.00000000e-01,
     6.10000000e-01,   6.20000000e-01,   6.30000000e-01,
     6.40000000e-01,   6.50000000e-01,   6.60000000e-01,
     6.70000000e-01,   6.80000000e-01,   6.90000000e-01,
     7.00000000e-01,   7.10000000e-01,   7.20000000e-01,
     7.30000000e-01,   7.40000000e-01,   7.50000000e-01,
     7.60000000e-01,   7.70000000e-01,   7.80000000e-01,
     7.90000000e-01,   8.00000000e-01,   8.10000000e-01,
     8.20000000e-01,   8.30000000e-01,   8.40000000e-01,
     8.50000000e-01,   8.60000000e-01,   8.70000000e-01,
     8.80000000e-01,   8.90000000e-01,   9.00000000e-01,
     9.10000000e-01,   9.20000000e-01,   9.30000000e-01,
     9.40000000e-01,   9.50000000e-01,   9.60000000e-01,
     9.70000000e-01,   9.80000000e-01,   9.90000000e-01,
     1.00000000e+00,   1.01000000e+00])

avp = 100*np.array(
 [[ 0.00324696,  0.00641694,  0.00953238,  0.0126017 ,  0.01562987,
    0.01862029,  0.02157548,  0.02449743,  0.02738778,  0.03024788,
    0.05738761,  0.0822719 ,  0.10525907,  0.12658293,  0.1464181 ,
    0.16490438,  0.18215844,  0.19828034,  0.21335753,  0.22746753,
    0.24067983,  0.25305715,  0.26465659,  0.27553032,  0.25547838,
    0.23790104,  0.22198642,  0.2074141 ,  0.19398549,  0.18155873,
    0.17002455,  0.15929482,  0.14929611,  0.13996587,  0.13124986,
    0.12310046,  0.11547534,  0.10833658,  0.10164995,  0.12563221,
    0.14689894,  0.16627677,  0.18410003,  0.20058033,  0.21587175,
    0.23009504,  0.2433491 ,  0.25571746,  0.26727216,  0.27807632,
    0.28818593,  0.29765116,  0.30651729,  0.31482546,  0.29236538,
    0.27252759,  0.25449115,  0.2379271 ,  0.22262886,  0.20844708,
    0.19526545,  0.18298923,  0.1715388 ,  0.1608458 ,  0.15085055,
    0.14150028,  0.13274787,  0.1245509 ,  0.11687089,  0.10967276,
    0.10292438,  0.09659617,  0.09066084,  0.08509314,  0.07986962,
    0.0749685 ,  0.07036946,  0.06605359,  0.06200322,  0.05820182,
    0.05463397,  0.05128519,  0.04814195,  0.04519158,  0.04242218,
    0.03982263,  0.03738247,  0.03509191,  0.03294176,  0.0309234 ,
    0.02902874,  0.02725019,  0.02558063,  0.02401338,  0.02254216,
    0.02116109,  0.01986464,  0.01864762,  0.01750516,  0.01643271,
    0.01542596,  0.01448089,  0.01359372,  0.0127609 ,  0.01197911,
    0.01124522,  0.01055628,  0.00990956,  0.00930246,  0.00873255]])

z = np.array(
  [ 0.        ,  0.11111111,  0.22222222,  0.33333333,  0.44444444,
    0.55555556,  0.66666667,  0.77777778,  0.88888889,  1.        ])

por = np.array(
  [[  0.        ,   0.        ,   0.        ],
   [ 10.62834433,   5.71540426,   0.79195768],
   [ 18.10955225,  11.14818494,   1.55981113],
   [ 23.22767635,  16.0566849 ,   2.2801995 ],
   [ 26.62643019,  20.26892536,   2.93122316],
   [ 28.80909111,  23.69187844,   3.49311208],
   [ 30.15548187,  26.3014876 ,   3.94882356],
   [ 30.93852215,  28.11965758,   4.28455203],
   [ 31.33977648,  29.18687894,   4.49013755],
   [ 31.4624026 ,  29.5381209 ,   4.55936353]])

settle = (np.interp(t,[0,0.15,0.3,0.45,4], [0.0,50,50,100,100]) - avp)

#########################################
#Tang and onitsuka input to generate expected values

#t = np.array([  1.00000000e-03,   2.00000000e-03,   3.00000000e-03,
#     4.00000000e-03,   5.00000000e-03,   6.00000000e-03,
#     7.00000000e-03,   8.00000000e-03,   9.00000000e-03,
#     1.00000000e-02,   2.00000000e-02,   3.00000000e-02,
#     4.00000000e-02,   5.00000000e-02,   6.00000000e-02,
#     7.00000000e-02,   8.00000000e-02,   9.00000000e-02,
#     1.00000000e-01,   1.10000000e-01,   1.20000000e-01,
#     1.30000000e-01,   1.40000000e-01,   1.50000000e-01,
#     1.60000000e-01,   1.70000000e-01,   1.80000000e-01,
#     1.90000000e-01,   2.00000000e-01,   2.10000000e-01,
#     2.20000000e-01,   2.30000000e-01,   2.40000000e-01,
#     2.50000000e-01,   2.60000000e-01,   2.70000000e-01,
#     2.80000000e-01,   2.90000000e-01,   3.00000000e-01,
#     3.10000000e-01,   3.20000000e-01,   3.30000000e-01,
#     3.40000000e-01,   3.50000000e-01,   3.60000000e-01,
#     3.70000000e-01,   3.80000000e-01,   3.90000000e-01,
#     4.00000000e-01,   4.10000000e-01,   4.20000000e-01,
#     4.30000000e-01,   4.40000000e-01,   4.50000000e-01,
#     4.60000000e-01,   4.70000000e-01,   4.80000000e-01,
#     4.90000000e-01,   5.00000000e-01,   5.10000000e-01,
#     5.20000000e-01,   5.30000000e-01,   5.40000000e-01,
#     5.50000000e-01,   5.60000000e-01,   5.70000000e-01,
#     5.80000000e-01,   5.90000000e-01,   6.00000000e-01,
#     6.10000000e-01,   6.20000000e-01,   6.30000000e-01,
#     6.40000000e-01,   6.50000000e-01,   6.60000000e-01,
#     6.70000000e-01,   6.80000000e-01,   6.90000000e-01,
#     7.00000000e-01,   7.10000000e-01,   7.20000000e-01,
#     7.30000000e-01,   7.40000000e-01,   7.50000000e-01,
#     7.60000000e-01,   7.70000000e-01,   7.80000000e-01,
#     7.90000000e-01,   8.00000000e-01,   8.10000000e-01,
#     8.20000000e-01,   8.30000000e-01,   8.40000000e-01,
#     8.50000000e-01,   8.60000000e-01,   8.70000000e-01,
#     8.80000000e-01,   8.90000000e-01,   9.00000000e-01,
#     9.10000000e-01,   9.20000000e-01,   9.30000000e-01,
#     9.40000000e-01,   9.50000000e-01,   9.60000000e-01,
#     9.70000000e-01,   9.80000000e-01,   9.90000000e-01,
#     1.00000000e+00,   1.01000000e+00])
#
#H = 1
#z  = np.linspace(0, H,10)
#kv, kh, ks, kw = (10, 10, 10, 1e7)
#mv=1
#gamw = 10
#rw, rs, re = (0.03, 0.03, 0.5)
#drn = 1
#surcharge_vs_time = ((0,0.15, 0.3, 0.45,100.0), (0,50,50.0,100.0,100.0))
#tpor = t[np.array([20,60,90])]
#nterms = 20
#
#por, avp, settle = tangandonitsuka2000(z=z, t=t, kv=kv, kh=kh, ks=ks, kw=kw, mv=mv, gamw=gamw, rw=rw, rs=rs, re=re, H=H,
#                   drn=drn, surcharge_vs_time=surcharge_vs_time,
#                   tpor=tpor, nterms=nterms)
##################################################################

reader = ("""\
H = 1
drn = 1
dTv = 1 #dTv=kvref/mvref/gamw/H**2
#re=0.5, rw = 0.03, n = 16.6667, mu = 2.074475589,
#dTh = 2*khref/mvref/gamw/mu


dTh = 3.856396307

neig = 20

mvref = 1.0
kvref = 10.0
khref = 10.0
etref = 3.856396307 #2/mu/re**2

mv = PolyLine([0,1], [1,1])
kv = PolyLine([0,1], [1,1])
kh = PolyLine([0,1], [1,1])
et = PolyLine([0,1], [1,1])


surcharge_vs_depth = PolyLine([0,1], [1,1])
surcharge_vs_time = PolyLine([0,0.15,0.3,0.45,4],[0.0,50,50,100,100])


ppress_z = np.%s
avg_ppress_z_pairs = [[0,1]]
settlement_z_pairs = [[0,1]]
ppress_z_tval_indexes = [20, 60, 90]
tvals = np.%s

""" % (repr(z), repr(t)))


a = Speccon1dVR(reader)
a.make_all()

# custom plots
title = ("Tang and Onitsuka (2000) vertical and radial drainage")
fig = plt.figure(figsize=(12,5))
fig.suptitle(title)
#z vs u
ax1 = fig.add_subplot("131")
ax1.set_xlabel('Excess pore pressure, kPa')
ax1.set_ylabel('Depth')
ax1.invert_yaxis()
ax1.plot(por, z,
         ls="None", color='Blue', marker="+", ms=5,
         label='expected')
ax1.plot(a.por, z,
         ls='-', color='red', marker='o', ms=5, markerfacecolor='None',
         markeredgecolor='red',
         label='calculated')

# avp vs t
ax2 = fig.add_subplot("132")
ax2.set_xlabel('Time')
ax2.set_ylabel('Average excess pore pressure, kPa')
ax2.set_xscale('log')
ax2.set_xlim((0.01, 10))
ax2.plot(t, avp[0],
         ls="None", color='Blue', marker="+", ms=5,
         label='expected')
ax2.plot(t, a.avp[0],
         ls='-', color='red', marker='o', ms=5, markerfacecolor='None',
         markeredgecolor='red',
         label='calculated')


# settlement vs t
ax3 = fig.add_subplot("133")
ax3.set_xlabel('Time')
ax3.set_ylabel('Settlement')
ax3.invert_yaxis()
ax3.set_xscale('log')
ax3.set_xlim((0.01, 10))
ax3.plot(t, settle[0],
         ls="None", color='Blue', marker="+", ms=5,
         label='expected')
ax3.plot(t, a.set[0],
         ls='-', color='red', marker='o', ms=5, markerfacecolor='None',
         markeredgecolor='red',
         label='calculated')
leg = ax3.legend()
leg.draggable()

fig.subplots_adjust(top=0.90, bottom=0.15, left=0.1, right=0.94, wspace=0.4)
#fig.tight_layout()
plt.show()
(Source code, png, hires.png, pdf)

