# specbeam example(if viewing this in docs, plots are at bottom of page)


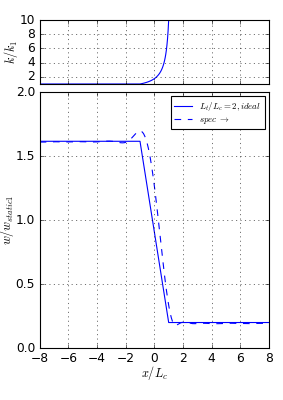
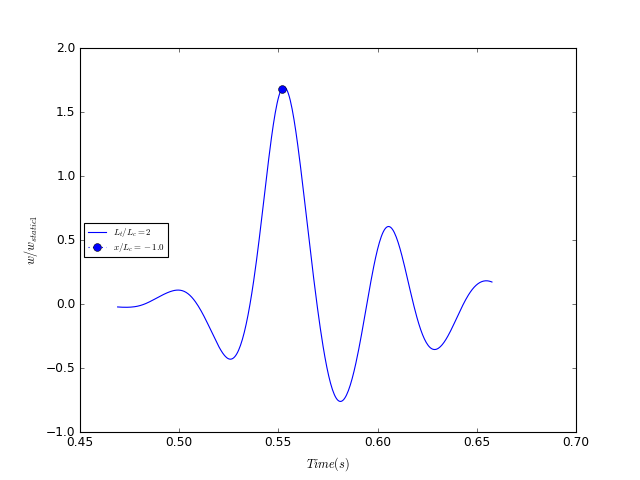
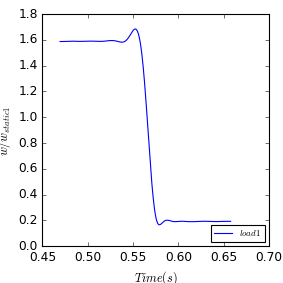
# Point load moving at constant speed on beam on elastic foundation.
# transitions from stiffness k1 to stiffness k2 over a distance that is
# twice the k1-portion's characteristic length (Lc).  damping remains constant at
# the k1-portion's value. stiffness change is non-linear but was 'designed'
# to acheive linear displacement change within the transition zone.

# ONe of the plots will look blank.  This is because it is an animation,and
# animations don't show in the docs.  To see the animation run from source
# code.

import matplotlib.pyplot as plt
import matplotlib
import numpy as np
#from collections import OrderedDict

#from geotecha.plotting.one_d import MarkersDashesColors
#from geotecha.piecewise.piecewise_linear_1d import PolyLine
from geotecha.beam_on_foundation.specbeam import SpecBeam
from geotecha.beam_on_foundation.specbeam import transition_zones1

matplotlib.style.use('classic')


#example of deflection envelope
for alpha_design, alphas, reverses in zip(
            [0.8],
            [[0.8]],
            [[False]]
             ):

    transition_zones1(xlim = (-8,8),
       ntrans = 50, # number of points to sample analytical trasnstion zone
        kratio = 10,
        beta = 0.1,
        nx = 400,     #number of x points
        nt=400, #number of time values
        nterms=150,
        force_calc=False,
        ninterp = 50, # number of points to discretize the transition zone
        nloads = 1,
        load_spacing = 0.03,
        Lt_Lcs = [2], #2,4,6],
        t_extend = 1.0, # factor to extend maximum evalutated time.
        DAF_distribution = "linear",
#        tanhend=0.01,
        alpha_design = alpha_design, #alpha for back calculating k profile
        alphas = alphas,
        reverses=reverses,
#        saveas=saveas,
        animateme=True,

        xi_Lc=True, #ratio of xinterest over characteristic length)
        article_formatting=False)
plt.show()


